Project: United Superstore Performance Analysis Report
United Superstore, a prominent online retail company, has reached out to your team as a contractor to carry out a performance analysis of all their stores across the United States of America. You’ve been provided with the following project document:
Project Overview
Client: United Superstore
Project Name: Comprehensive Sales and Profit Analysis for Business Expansion
Project Introduction:
United Superstore, a prominent online retail entity established in 2014, has been on a trajectory of substantial year-to-year growth in sales. Recognizing the potential for further expansion, key stakeholders have decided to venture into the physical retail space by establishing large store chains in strategically selected cities across the United States.
Project Background:
The decision to expand was made during the end-of-year strategy session in 2014. The focus is on opening physical stores in cities with the highest sales within their most successful states. To ensure the success of this expansion, a comprehensive analysis of sales and profit data is crucial. This analysis will provide valuable insights into the overall performance of different states, guiding strategic decisions for successful business growth.
Project Objectives:
The primary objective is to conduct an in-depth analysis of sales and profit data, addressing key performance indicators (KPIs) to assess the overall performance of various states. The insights gained will inform decision-making for the expansion strategy.
Analysis Focus Areas:
- Year-on-Year Growth in Sales
- Sales Performance Across All States
- Product Performance in States
- Average Order Value
- Profit Margin
- Average Delivery Timeline
- Total Quantity Sold
- Total Profit
Business Questions:
The analysis will answer critical business questions to guide strategic decisions:
- What are the top three selling states, and how do these states perform in terms of profit, quantity sold, and the number of customers?
- Within the top-selling states, which are the top two cities in terms of sales performance?
- What is the average timeline for delivering products to customers, ensuring efficient logistics?
- Identify the top-performing product categories and subcategories in the top three states and cities, providing insights for targeted marketing and inventory management.
Expected Deliverables:
- Comprehensive report detailing the analysis of key performance indicators.
- Recommendations based on the analysis to guide strategic decision-making for the business expansion.
- Visual representations of data through charts and graphs for easier interpretation (a dashboard).
- An app showing key performance indicators and trends for use on the go.
Timeline:
The project is expected to be completed on May 24, 2024, to ensure timely and actionable insights for the business expansion strategy.
Data:
Make a copy of the provided data
Deliverables
- Data Analysis Sheet
- Analysis Report
- Dashboard
- Glide App
Submission:
Complete this form to submit your project.
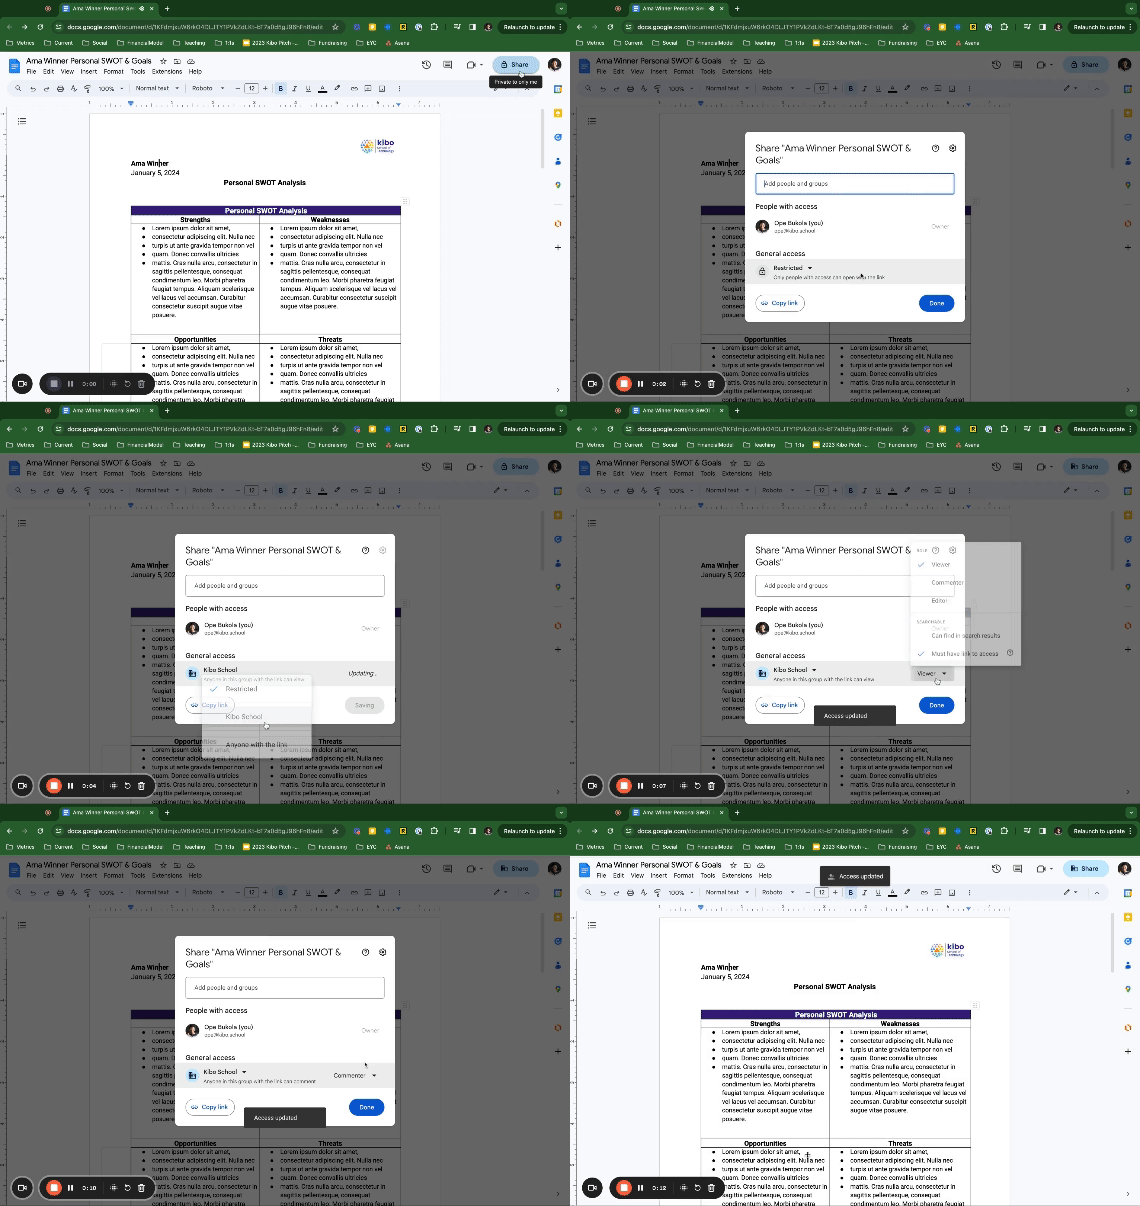
Ensure the documents are set to enable to comment. See below for a demo of how to change sharing settings.
