🔢 Data and Spreadsheets
As a multidisciplinary field, data science uses myriads of tools for different tasks within the phases of the data science workflow, and we'll explore some of these tools in this course. In this section, we'll start by looking at spreadsheets, and further explore a popular web-based spreadsheet software - Google Sheet. To start with, let us understand what we mean by spreadsheets and why we need them as data scientist.
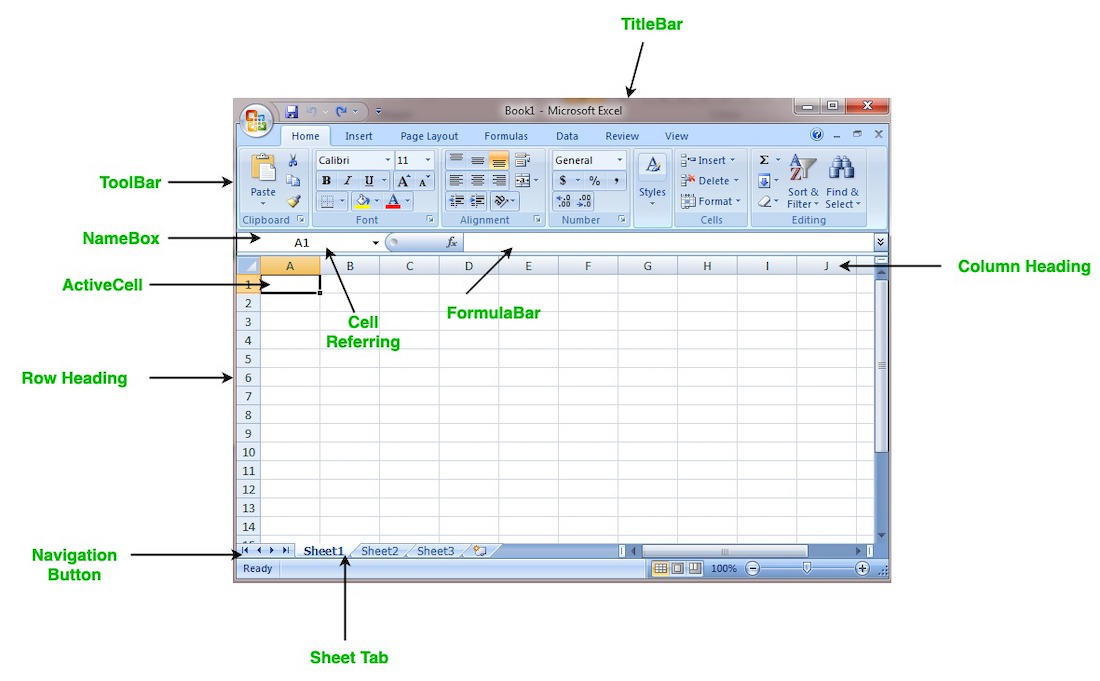
What are Spreadsheets?
They are often designed to hold numeric and short text data types. Today, there are many spreadsheet programs out there which can be used locally on your PC or online through your browsers. They provide different features to ease data manipulation as shown below.
Overall, spreadsheets are a useful tool for data science tasks, particularly for tasks that involve organizing, manipulating, and analyzing data on a smaller scale. However, for more complex data analysis tasks or larger datasets, specialized software tools and/or programming languages may be required.
How can i use spreadsheet?
Popular spreadsheet softwares currently available includes Microsoft Excel, Apple Numbers, LibreOffice, OpenOffice, Smartsheet, and Zoho Sheet among others. However, Microsoft Excel is the most popular within the data science communities. To get started quickly without any installation bottleneck, we'll be using Google Sheet - a web-based spreadsheet.
Next, we'll explore a sample dataset using Google Sheet. As we've learnt in the previous video, you can have more than one worksheet in a workbook. In this sample dataset, we have 3 worksheets with different dataset.
- corona_virus - official daily counts of COVID-19 cases, deaths and vaccine utilisation.
- movies - information about movies, including their names, release dates, user ratings, genres, overviews, and others.
- emissions - information about methane gas emissions globally.
👩🏾🎨 Practice: Data playground... 🎯
- Create a copy of this dataset for your own use.
- Explore each worksheet to have a sense of what the data represent.
- Attempt the following questions.
- Which country 🏳️ has the highest number of
activeCOVID-19 cases? - Which movie 🎞️ has the
lowestbudget? - What is the total
emmisions🌅 globally? - Try to change the 🔴 colour of each workbook.
- Which country 🏳️ has the highest number of
Note: Remember to use the built-in functions where neccessary.