🔢 Data and Spreadsheets
As a multidisciplinary field, data science uses myriads of tools for different tasks within the phases of the data science workflow, and we'll explore some of these tools in this course. In this section, we'll start by looking at spreadsheets, and further explore a popular spreadsheet software - Microsoft Excel. To start with, let understand what we mean by spreadsheets and why we need them as data scientist.
What are spreadsheets?
Spreadsheets are softwares that allows a user to capture, organize, and manipulate data represeted in rows and columns. They are often designed to hold numeric and short text data types. Today, there are many spreadsheet programs out there which can be used locally on your PC or online through your browsers. They provide different features to ease data manipulation as shown below.

Benefits of spreadsheets
- Ease of use - Spreadsheets are widely used and familiar to many people, making them easy to use.
- Data organization - Spreadsheets provide a structured way to organize data, making it easier to sort, filter, and analyze datasets.
- Data analysis - Spreadsheets provide a range of functions and formulas that allow for basic data analysis, such as summing, averaging, and finding min/max values.
- Collaboration - Spreadsheets can be easily shared and edited by multiple users, making them a useful tool for collaboration and teamwork.
- Cost-effective - Many spreadsheet programs are available for free or at a low cost, making them an affordable option for data analysis.
Overall, spreadsheets are a useful tool for data science tasks, particularly for tasks that involve organizing, manipulating, and analyzing data on a smaller scale. However, for more complex data analysis tasks or larger datasets, specialized software tools and/or programming languages may be required.
How can i use spreadsheet?
Popular spreadsheet softwares currently available includes Microsoft Excel, Apple Numbers, LibreOffice, OpenOffice, Smartsheet, and Zoho Sheet among others. However, Microsoft Excel is the most popular within the data science communities. For this week, we'll be using Microsoft Excel.
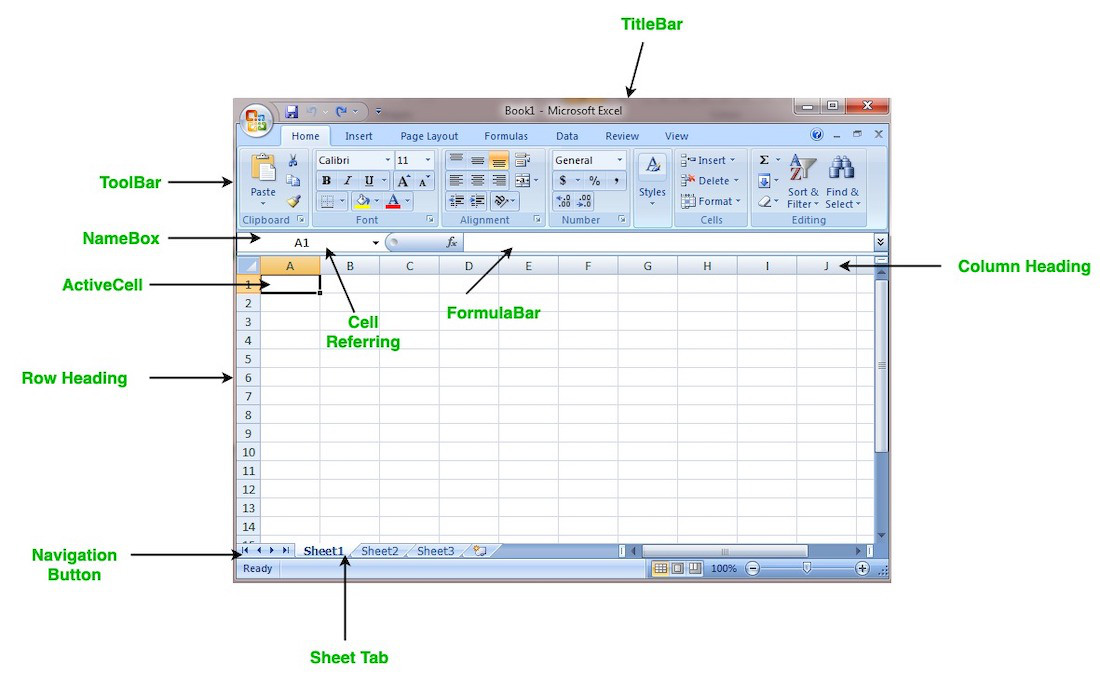
A brief recap of Microsoft Excel...
- Microsoft Excel is a free spreadsheet program create by
Microsoft. - By default, it comes pre-installed as part of your operating system.
- To create a new sheet, launch your Excel app locally or use Office365.
- select a blank workbook or use prdefined templates.
- Enter your data in rows and columns across the worksheet.
- Microsoft Excel app doesn't automatically save your work, unless you configure it to do so.
- There are predefined
built-infunctions to help you with basic and complex arithmetics. Some basic ones are;- AVG - finds the average of a range of cells
- SUM - adds up a range of cells
- MIN - finds the minimum of a range of cells
- MAX - finds the maximum of a range of cells
- COUNT - counts the values in a range of cells
Next, we'll explore a sample dataset using Microsoft Excel. As we've learnt in the previous video, you can have more than one worksheet in a workbook. In this sample dataset, we have 3 worksheets with different dataset.
- corona_virus - official daily counts of COVID-19 cases, deaths and vaccine utilisation.
- movies - contains information about movies, including their names, release dates, user ratings, genres, overviews, and others.
- emissions - contains information about methane gas emissions globally.
➡️ In the next section, we'll introduce you to
data cleaning🎯.